How to Test Solubility: Lab Methods That Work
Learn how to test solubility with step-by-step lab methods for research compounds, including solvent choice, sample prep, and reading results accurately.

A peptide can disappear from view within minutes, leaving a solution that looks ready for an assay. The next day, however, the result may shift, a chromatogram may show unexpected material, or a preparation may turn cloudy after standing. That failure usually begins with treating visual clarity as proof of solubility.
A defensible answer to how to test solubility requires more than watching a powder vanish. The laboratory must define the solvent, temperature, pH, equilibration time, solid form, separation step, and analytical method. It must also distinguish a rapid, temporary dispersion from a saturated solution at equilibrium.
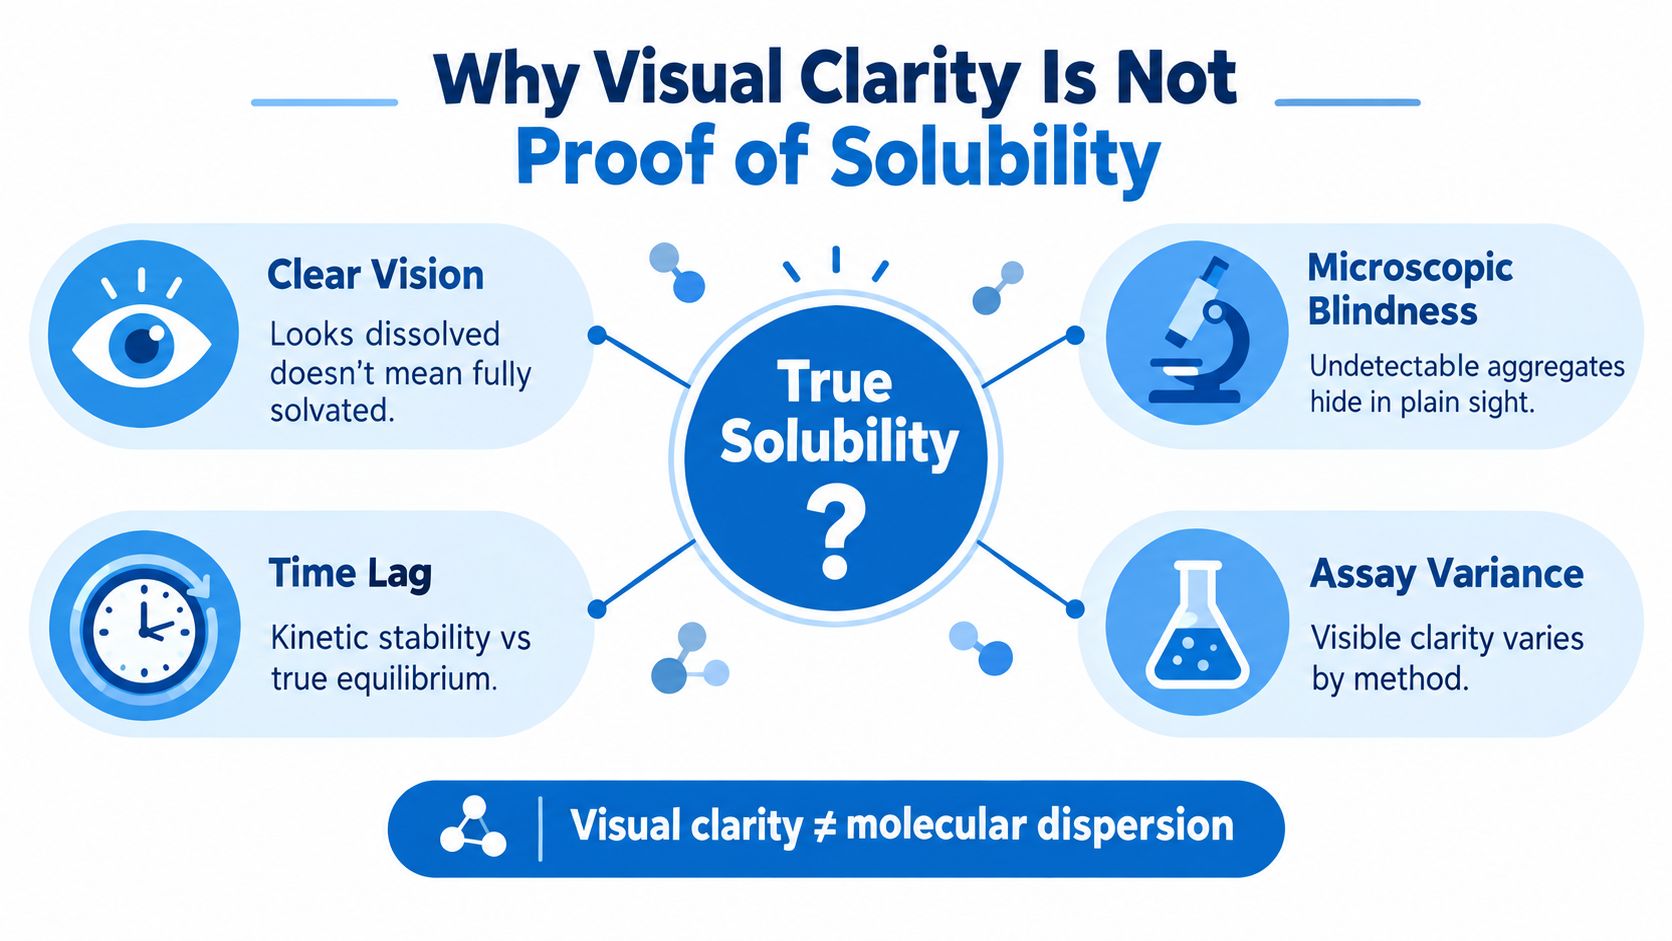
Why Visual Clarity Is Not Proof of Solubility
A sample can turn clear within minutes and still fail a concentration check later. That result usually reflects dissolution rate, dispersion, or temporary aggregation behavior rather than the final capacity of the solvent. The United States Pharmacopeia describes solubility as the capacity of a solvent to dissolve a solute, while dissolution rate describes how quickly that capacity is approached (USP discussion of solubility and dissolution rate).
A clear vial answers only a visual question. It does not show that every molecule exists as a dissolved species, that aggregates are absent, or that the concentration will remain stable during handling. Nephelometry, UV/Vis, filtered UV/Vis, HPLC, and LC–MS may therefore produce different results when particles, matrix components, or sample preparation influence the measurement (OECD guidance on good in vitro method practices).
What a reproducible result must state
A useful solubility result describes a saturated liquid phase under defined conditions. OECD Test Guideline 105 defines water solubility as the saturation mass concentration at a specified temperature and commonly reports it in g/L (OECD Test Guideline 105).
At minimum, record:
- Solvent composition: Identify water, buffer components, co-solvents, counterions, and concentration.
- Temperature: Record the set point and control temperature during equilibration and separation.
- pH: Measure the actual pH rather than relying only on the buffer label.
- Equilibration time: State how long excess solid contacted the liquid and how stability was assessed.
- Solid form: Note whether the material was amorphous, crystalline, lyophilized, or otherwise specified.
- Separation method: Identify filtration or centrifugation and document membrane compatibility where relevant.
- Quantification method: Report the assay, calibration approach, units, and selectivity checks.
Practical rule: Treat “dissolved” as an observation and “equilibrium solubility” as a measured concentration tied to controlled conditions. The two require different evidence.
Without these details, comparisons between preparations become unreliable. A valid number can still be difficult to interpret if the record does not show whether it represents intrinsic solubility in water, apparent solubility in a buffer, or a short-term kinetic measurement. Aggregate formation, adsorption during filtration, and concentration changes during standing can each shift the reported result.
Choosing Between Flask and Column Methods
A flask can report a clear solution even when colloids or fine crystals remain in the sample. Choose the method according to the concentration range, sample quantity, and risk of aggregation rather than visual appearance alone.
Shake-flask testing
Use shake-flask testing when sufficient material is available and the expected concentration supports reliable quantification. Begin with a small preliminary study to estimate the solid loading and contact time needed to approach saturation. For the definitive test, place excess solid in tightly stoppered vessels containing a measured liquid volume. Agitate at controlled temperature, keeping undissolved material present so the liquid phase can approach equilibrium.
Around 10 mg/L is a practical dividing point in established water-solubility guidance. Shake-flask testing generally suits concentrations above this range, while column elution or slow-stirring approaches are better suited to lower levels, as described in the OECD Test Guideline 105 water-solubility publication. Use replicate vessels and temperature-controlled separation. Sample the clear liquid phase only after confirming that the separation step does not remove dissolved analyte.
A concentration plateau is not enough on its own. Compare samples collected at different times, and check the result against the appearance and analytical profile of the sample. If a peptide forms colloids, a flask can produce an apparent or kinetic solubility value that exceeds true equilibrium solubility.
Column elution for very low solubility
A generator column holds excess test substance on an inert support while water passes through at a controlled rate. Collect sequential fractions and track concentration until successive fractions give a stable plateau. The plateau provides the solubility estimate only when the column remains properly loaded and the signal is not controlled by adsorption or carryover.
Column work reduces several problems that become serious at low concentrations. Trace-level analytical error, adsorption to vessel or filter surfaces, colloids, and suspended microcrystals can overwhelm a flask result. The trade-off is greater operational demand. Record the support and column dimensions, loading procedure, flow rate, temperature, recovery, and evidence that the plateau is independent of later sampling time.
| Parameter | Shake-Flask Method | Column-Elution Method |
|---|---|---|
| Main architecture | Excess solid in stoppered vessels | Excess substance on an inert support |
| Best fit | Equilibrium work with adequate sample | Very low-solubility or trace-level measurement |
| Main risk | Incomplete equilibration, colloids, surface losses | Channeling, inadequate coating, excessive flow |
| Measurement pattern | Separated liquid-phase concentration | Concentration across sequential eluate fractions |
| Material demand | May require substantial excess solid | Can suit samples for which direct flask work is impractical |
For peptide research compounds, assess aggregation and chemical instability before selecting either design. A poorly coated column can underreport solubility because water bypasses active material. A flask can overreport it when suspended aggregates pass through separation or remain detectable during analysis. Reproducible sampling and a selective assay matter as much as the apparatus.
Selecting Solvents and Buffer Systems
Solvent selection should begin with the intended measurement, not with the most familiar buffer. A water-solubility result answers a different question from a formulation-screening result in buffered saline or a co-solvent system. If the experiment changes pH, ionic strength, counterion, or organic-solvent content, the endpoint has changed with it.
Start with a screening matrix
For an ionizable peptide or related research compound, small-volume serial dilutions across the intended pH and buffer range can reveal where precipitation, aggregation, or chemical instability begins. Screening is not a substitute for equilibrium measurement, but it prevents a full experiment from being committed to a visibly unsuitable medium.
A useful screen records:
- pH response: Measure pH before and after adding the compound, since the sample can shift the final value.
- Buffer identity: Record the salt, concentration, and counterions, not just “PBS” or “acetate buffer.”
- Co-solvent fraction: State the exact DMSO or ethanol content and keep it constant across standards and samples.
- Physical appearance: Note clarity, haze, precipitate, and any delayed change after standing.
- Chemical stability: Check whether the assay detects intact analyte rather than degradation products.
Buffer composition can stabilize one peptide while encouraging aggregation in another. Phosphate may precipitate with certain metal ions, while acetate can alter charge states. Counterions and salt content can also influence the apparent result. These effects mean that a value measured in PBS at a stated pH shouldn't be presented as intrinsic water solubility.
Document the solvent as part of the result
A change in co-solvent content can shift apparent solubility substantially, even when the vial still looks clear. The record should therefore state solvent percentages, buffer preparation details, pH measurement conditions, temperature, and whether the solution was prepared directly or diluted from a stock.
Product-specific documentation can support method planning, but it doesn't replace laboratory verification. Researchers can consult the Pro Tec Pep compound research library for compound-level information before defining a solvent screen, then confirm the selected conditions with a validated assay.
Record the medium as carefully as the concentration. A solubility number without solvent composition is incomplete.
For non-aqueous systems, the same principle applies. A result in DMSO may be useful for stock preparation but shouldn't be compared directly with a result in water or physiological buffer. The most useful protocol names the scientific question first, then selects a medium that answers it without introducing avoidable precipitation or degradation.
Analytical Methods for Confirming True Solubility
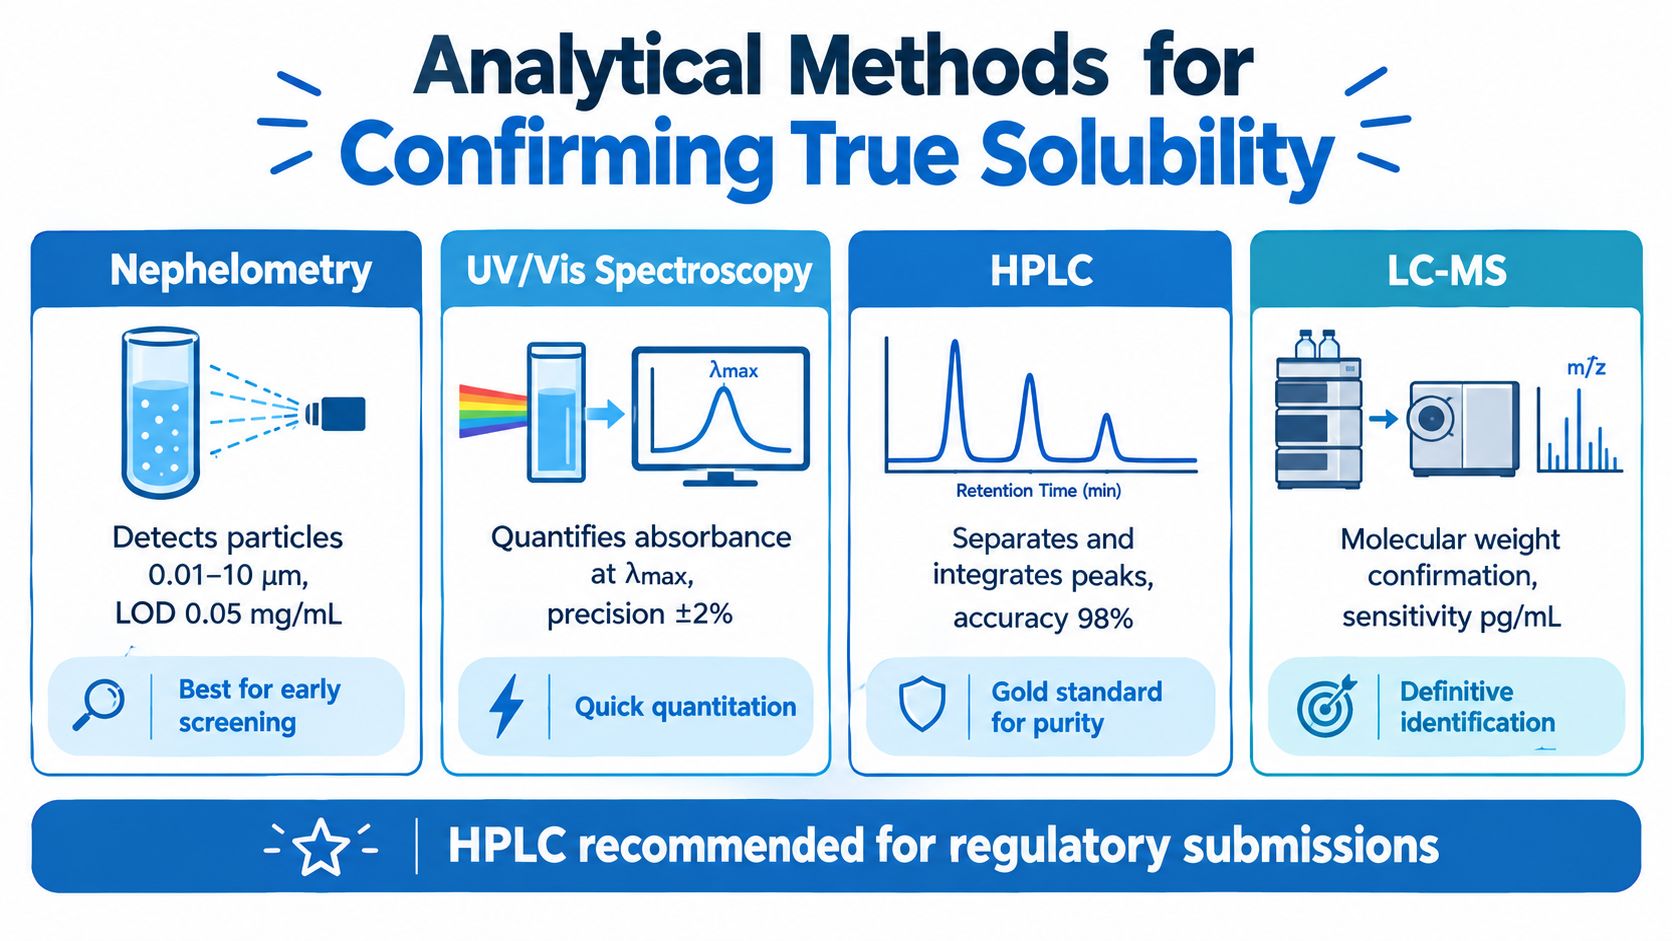
A clear vial can still contain dissolved monomer, colloidal material, or aggregates that distort the result. The analytical method defines what the laboratory reports as “dissolved.” Nephelometry detects suspended particles, UV/Vis measures light absorption, HPLC separates chemical species, and LC–MS adds molecular-weight evidence. Each answers a different question, so the method must match the suspected failure mode.
Match detection to the failure mode
Nephelometry is useful for screening turbidity and particle formation. It can reveal suspended material, but it cannot reliably separate dissolved monomer from aggregate. Particle size and refractive properties also change the signal, making nephelometry a screening tool rather than proof of true solubility.
UV/Vis spectroscopy is fast and accessible when the compound has a suitable absorbance feature. Its limitation is selectivity. Solvents, buffers, impurities, degradation products, and aggregates may absorb at the same wavelength. Treat a single UV reading as a concentration estimate only after checking matrix interference and assay linearity.
HPLC with UV detection offers stronger compound specificity by separating the analyte from many interfering species before quantification. The method still requires calibration, linearity, recovery testing, and controls for adsorption or precipitation during preparation. These checks help distinguish a true equilibrium concentration from an apparent or kinetic result.
LC–MS supplies molecular-weight confirmation and high sensitivity when concentration is low or degradation is plausible. It requires careful control of matrix effects, ion suppression, carryover, and sample stability. The Pro Tec Pep testing information may help identify documentation relevant to incoming research materials, while the laboratory's own assay must establish whether the sample reached equilibrium.
Treat sample handling as part of the assay
Filtration may remove dissolved compound through membrane adsorption or alter the result when the membrane is incompatible with the solvent or analyte. Centrifugation avoids some adsorption risks, but low-density aggregates can remain in the supernatant.
A defensible workflow measures recovery from the selected filter, compares centrifuged and filtered aliquots when aggregation is suspected, and confirms that the signal represents intact compound. HPLC and LC–MS provide separation or molecular confirmation, while UV/Vis and nephelometry answer narrower questions about concentration, turbidity, or particle formation.
Recovery and selectivity belong inside the solubility method itself; a clean chromatogram on an unverified preparation proves nothing about the dissolved fraction.
Adapting Protocols for Limited or Unstable Samples
Excess-solid equilibrium testing gives a strong endpoint, but it can consume material quickly when only milligrams are available. Peptides and other research compounds may also degrade during prolonged handling or aggregate after repeated freeze-thaw cycles. A staged micro-volume design limits waste while preserving enough evidence to distinguish an apparent or kinetic result from a more stable equilibrium concentration.
Design around the sample you can spare
Choose the vessel before preparing dilutions. Low-bind microtubes or compatible microplates reduce hold-up volume and adsorption, but their surface area, material, and sealing can affect recovery. Establish the minimum sample mass required for each dilution, including the volume needed for replicate analysis and any dead volume in the transfer tools.
Plan aliquots as single-use portions. Reopening one stock repeatedly increases exposure to air, temperature changes, and handling stress. Reserve separate portions for concentration measurement, particle assessment, and a repeat condition. If the sample is unstable, prepare only the number of dilutions that can be processed within its documented hold time.
A material-sparing workflow can follow this sequence:
- Set the lowest practical volume: Confirm that each vessel supports adequate mixing, separation, and analytical recovery.
- Allocate sample before dosing: Include assay replicates, a preparation blank, and one retained portion for comparison.
- Use an efficient concentration series: Cover the expected working range without spending material on unnecessary intermediate points.
- Record physical losses: Note transfers, residual volume, visible deposits, and any sample remaining on vessel walls.
- Repeat a representative condition: A repeated plateau is more persuasive than a single apparent endpoint that may reflect transient supersaturation.
This approach treats sample consumption as part of method design. It also prevents a common failure, exhausting the material during screening and leaving no aliquot for confirmation.

Use particle measurements as supporting evidence
Dynamic light scattering can reveal aggregate formation when a sample appears clear but produces unstable assay results. It does not replace concentration measurement. In polydisperse samples, DLS may detect particles without accurately quantifying their number, and changes in particle size can complicate interpretation.
Fresh preparations reduce uncertainty from degradation. Limiting freeze-thaw exposure protects scarce material from avoidable stress. Record storage temperature, hold time, vessel type, aliquot history, and preparation order so a later assay failure can be traced to a condition rather than assigned vaguely to poor solubility.
Use a controlled shake flask when material and concentration permit. For scarce samples, begin with micro-volume vessels and planned single-use aliquots. At very low concentrations, a column approach may reduce handling losses where appropriate. When aggregation is plausible, pair a selective concentration assay with particle-sensitive evidence, because visual clarity alone cannot establish true solubility.
Troubleshooting Common Solubility Testing Problems
A cloudy sample after centrifugation doesn't identify the cause. It may contain undissolved solid, low-density aggregate, colloidal material, or a precipitation product that formed during cooling. Each possibility requires a different response, so the first step is to compare the original sample, the separated phase, and a freshly prepared replicate under the same temperature.
Filtration creates a different diagnostic problem. If concentration falls after filtration, the analyte may have adsorbed to the membrane, or supersaturation may have collapsed when the sample was disturbed. A membrane-recovery check and a centrifuged comparison can separate those explanations. The Pro Tec Pep FAQ resource may help locate product documentation, but the laboratory still needs compound-specific recovery data.
Temperature drift is another frequent source of disagreement. A vessel can appear equilibrated while its actual temperature changes during agitation, transfer, centrifugation, or analysis. Because solubility depends on temperature, the protocol should control and record the temperature across each stage, not only at the start.
When two runs disagree, compare conditions before blaming the compound. Temperature, equilibration time, separation, and assay selectivity often explain the difference.
A practical troubleshooting record should capture:
- Appearance over time: Record when haze, crystals, or color change first appeared.
- Physical handling: Note agitation, transfer, centrifugation, and filtration details.
- Solid form: Check whether a polymorphic or crystalline transition may have occurred.
- Analytical comparison: Review raw chromatograms or spectra rather than only final concentrations.
- Replicate agreement: Determine whether the failure affected one vessel or the entire set.
Solubility labels can be standardized descriptively, but numerical concentration remains the stronger technical record. USP categories range from very soluble, fewer than 1 part of solvent, through practically insoluble or insoluble, 10,000 parts or more, under the specified convention (USP descriptive solubility categories). Those labels should supplement, not replace, the measured concentration and its experimental conditions.
Pro Tec Pep provides research-use-only compounds, batch-linked documentation, and product information that can support solvent selection and incoming-material review. Researchers defining a reproducible solubility workflow can visit Pro Tec Pep to examine available materials and documentation before beginning method development.